
Hi SharePoint devs, Quite a while ago, I wrote a blog post QuickTip – Be efficiently schizophrenic with Office 365 and Chrome that explains to those of you who need to deal with multiple tenants how you can easily switch from an account to another.
Since then, I had in mind to do something similar with SPFx solutions debugging, after an unsuccessful mere try, I didn't really spend more time on it since, at the time, it was not part of my immediate needs. Obviously, that day arrived that it became really useful for me. I then went a bit deeper into it and came up with a solution I am starting to use. This solution is done and tested on Windows 10 only but I think the concept would be quite the same on Linux or Mac *I did not try it, if you do so, let met know ! Also, I only start to use this technique, I did not get into any issues using it so far, but maybe I missed some issues that it might cause, so, if you encounter or foresee any, let me know !
The idea : Multiple profiles for debugging in various user scenarios
On the Microsoft Docs, you can find a procedure that explains how to setup a debugging environment using VSCode and Chrome (or Edge). The technique explained further relies on Chrome profiles so we will follow the according procedure. If you have never seen this article before, reading it will help you better understand what follows. Basically, in .vscode\launch.json file, you can add and edit debug configurations, by default you have 2 entries "Local Workbench" to debug locally and "Hosted Workbench" to debug your solution within the Workbench hosted on SharePoint (so you can really interact with SharePoint APIs)
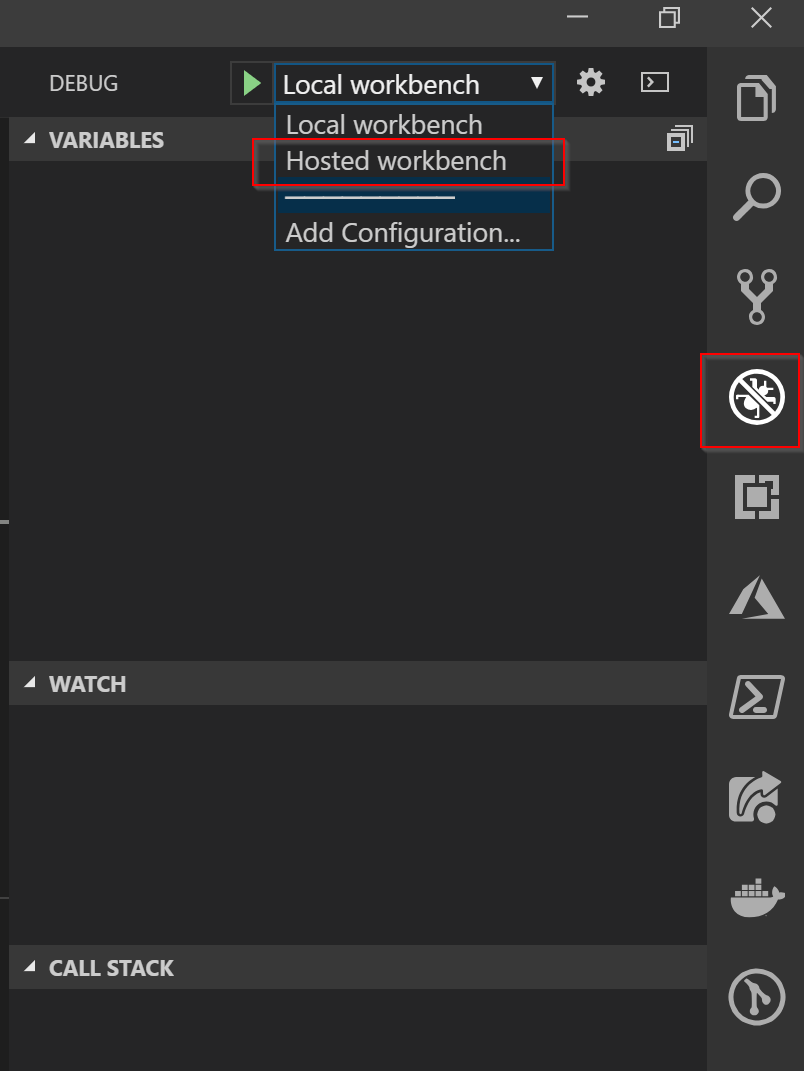
First we need to run gulp serve --nobrowser in order to serve locally the solution to debug. If you give that "Hosted Workbench" a try (you need to select it in the debug pane) and press F5 or click the "Play" button in VSCode. Chrome opens up in incognito mode, and obviously prompts you for logging in.

Since you are in incognito mode, none of your preferences, sessions, history will be kept, which means, that when you stop debugging and restart, you have once again to log in.

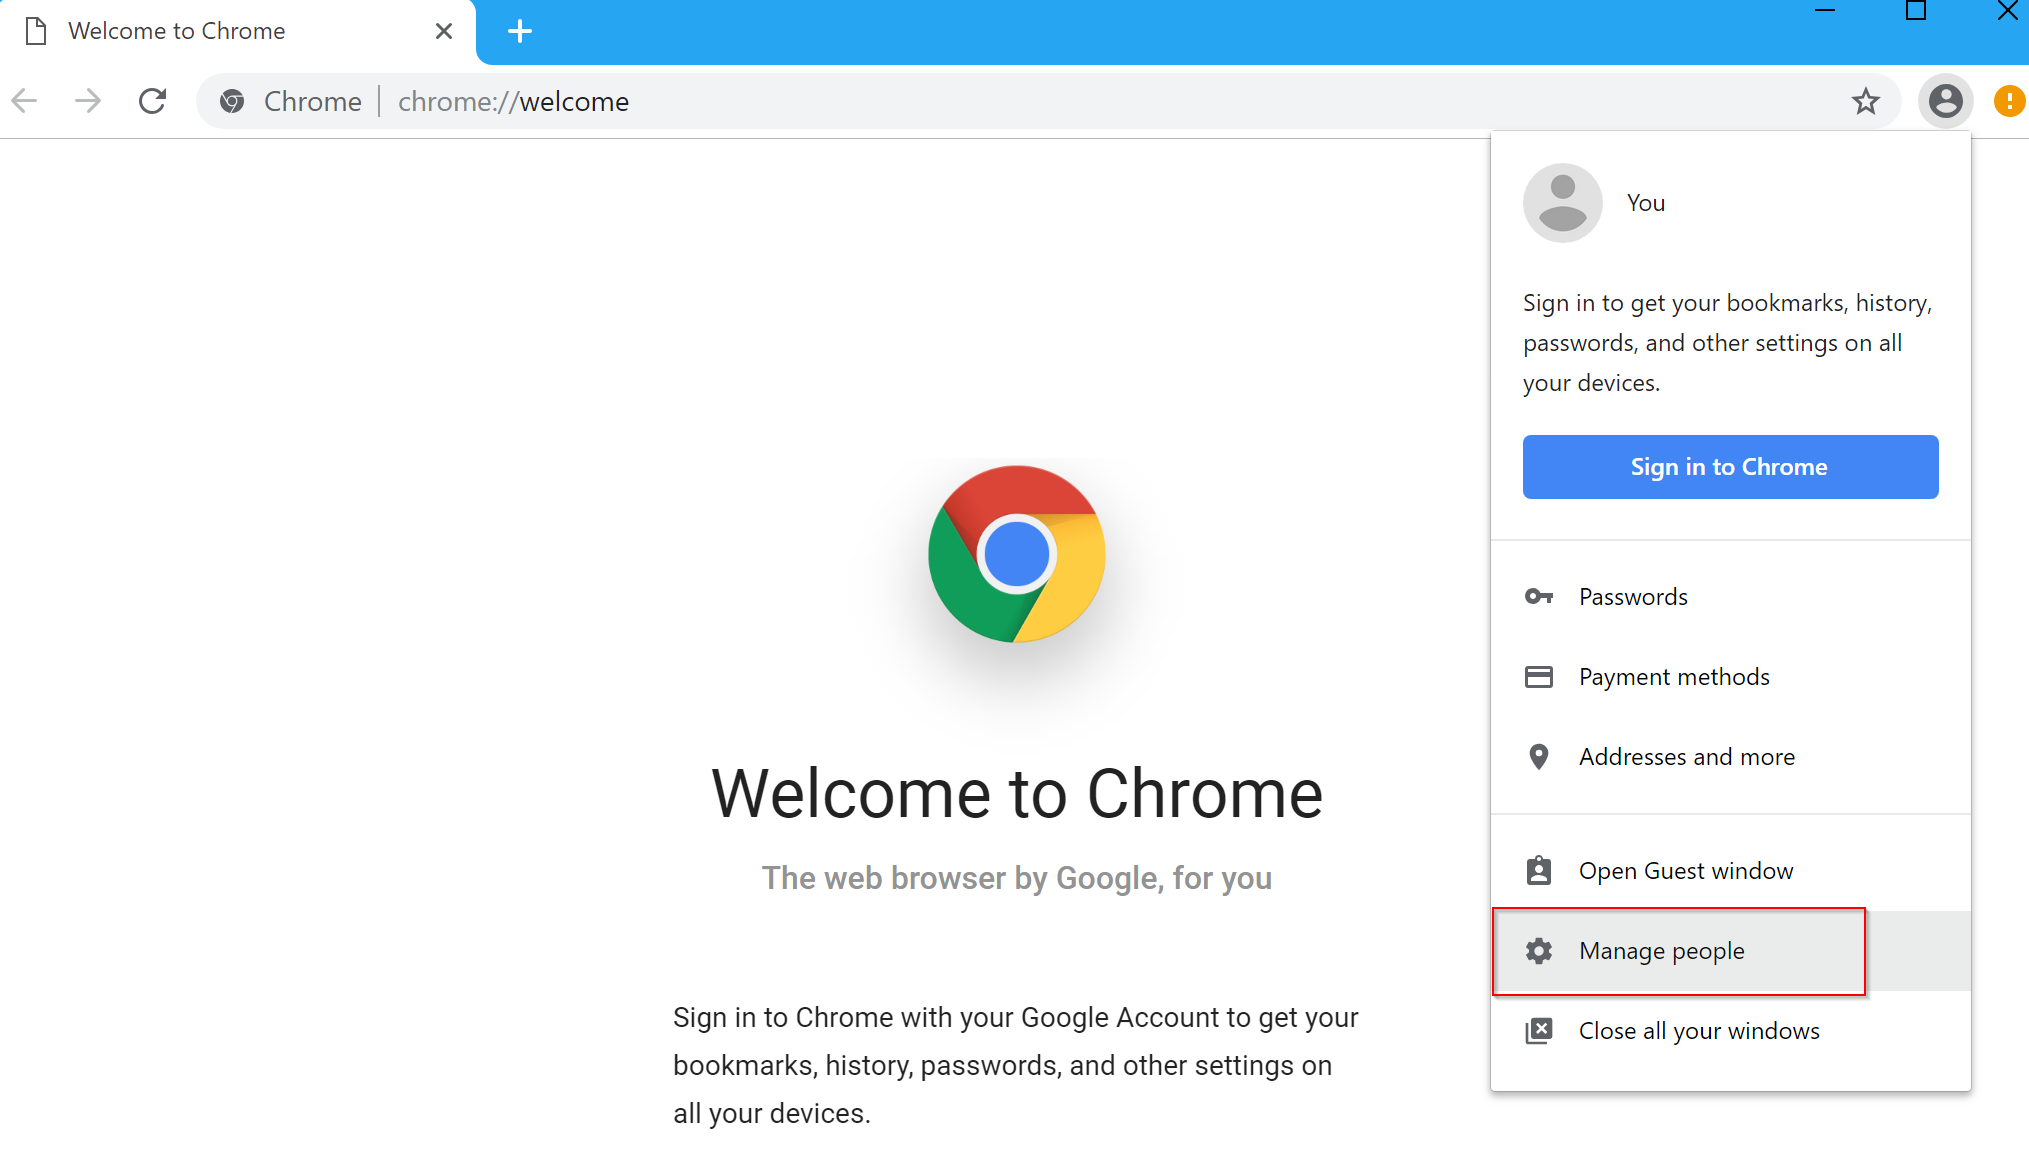
In my chrome settings, I have a bunch of profiles I use for my various accounts, They keep persisted sessions, cookies, passwords, etc...

It would be nice to have the same while debugging, Let's see if we can select other profiles in debugging. To do so, the first step is to disable incognito mode since profiles are not supported in that mode . In the launch.json config entry, get rid of the -incognito arguments specified in the runtimeArgs section and hit F5 ! Okay, now we can switch profiles but ... Hey where are all my profiles ?! Let's dig into it !
The Chrome User Data Directory
Chrome keeps all those profiles information in the local app data of your user %USERPROFILE%\AppData\Local\Google\Chrome\User Data
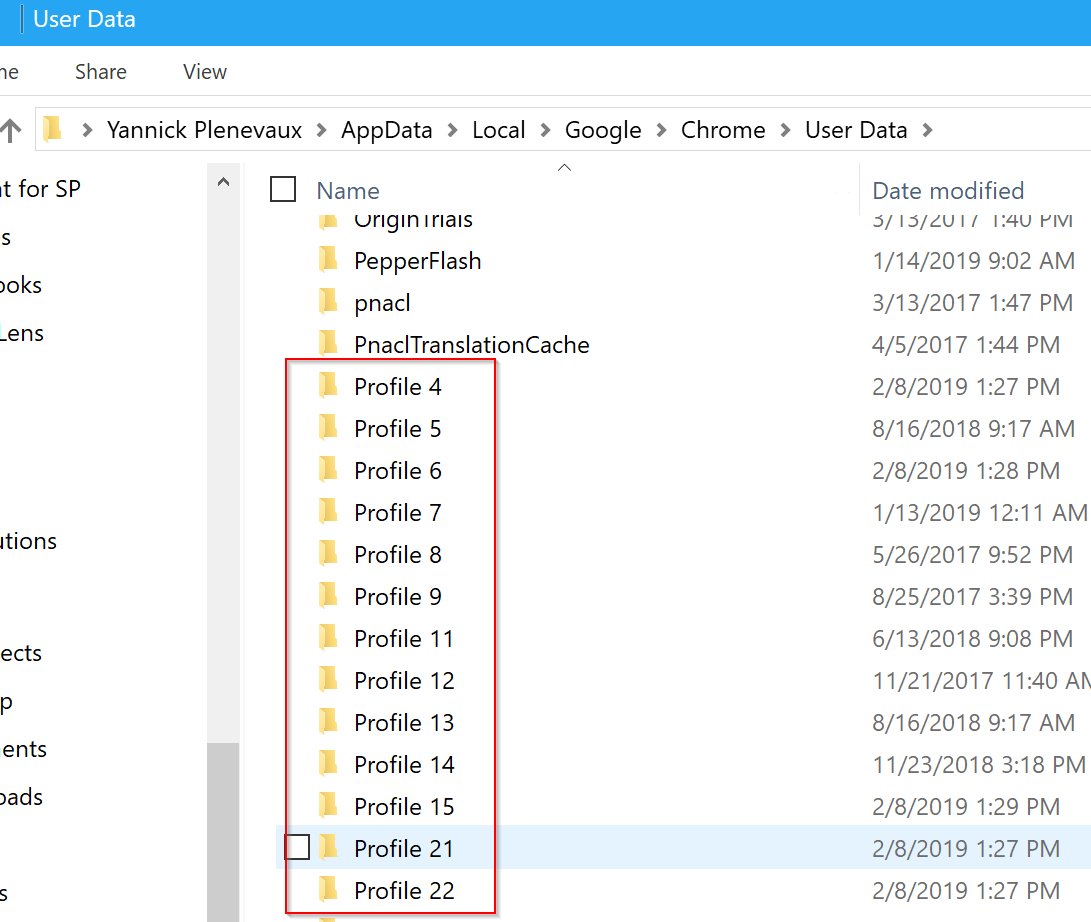
Yes, they are all named "Profile X" but they really contain the data of the profiles I gave names to in Chrome. So why does Chrome doesn't see them in debugging with VS Code ? If you check out the other possible entries of the config, you'll see something interesting

This userDataDir property default value is true which means VSCode will always recreate a temporary user directory and not use the one in your AppData. Let's play with this setting, let's try with a value set to false. Hey that seems to work, it opens up a new tab in my current Chrome session ! But wait... Yeah, that was too easy, after 10 secs, I get the following in VS Code

After a bit of searching, I learned it is actually some kind of limitation in Chrome, the --remote-debugging option cannot be used on the default Chrome "scope" if any browser window has been previously opened... Well, that is most likely the case, except if you use a different browser to read documentations etc...
So we cannot use our usual Chrome profiles
Basically, That's correct, we cannot use our default Chrome profiles configuration for debugging, at least, not easily... Okay, but can't we have another persisted configuration at least ? YES WE CAN ! And that is exactly what we are going to do, the userDataDir option can actually take 3 types of value:
- true: Use the "global" Chrome user data directory
- false: Recreate a temporary user data directory
- string: We can also specify the path of a folder to use as the user data directory.
Two approaches are now possible:
- Either you create a folder within your solution with configuration dedicated to it (I did not really went deeper that way because in my cases, I want to reuse my profiles in different solutions, but I would think it might be a valid approach as well)
- Use a shared folder that we can use in different solutions
Let's go for the shared folder.
Initialize a new user data (and profiles)
From a cmd prompt, type the following command > start chrome --user-data-dir="C:\Workspace\chrome\dev_user_data" You can specify whatever folder path you want (even not existing), you can see a new Chrome instance opening, you can also check the path you specified to see it has been initialized with a bunch of files. In that new instance, you can manage profiles and create the ones you want.


We can now set the userDataDir value to the path of our new folder, hit F5 and ... Cool ! that works, it takes the context with my created profiles. Let's try to go a bit further !
Specify profile in debug config
It is actually possible to specify the profile to use in the Chrome command line using the --profile-directory=Profile 3 switch. As you can see you have to specify the name of the folder which is not the name you gave to the profiles, By exploring them, you probably can determine what folder matches what profile. An easiest way is to check out the _Local State _file in the new User Data Dir that is a JSON file that contains many config entries as well as the profiles. You can also use this little PowerShell script I wrote that will return the matching values
param(
    [string]$UserDataDir = "C:\\Workspace\\chrome\\dev_user_dir"
)

$localStateJson = Get-Content "$UserDataDir\\Local State" $localState = $localStateJson | ConvertFrom-Json $profileKeys = $localState.profile.info_cache | Get-Member | ? { $_.MemberType -eq "NoteProperty" }
$infoCache = $localState.profile.info_cache
$allEntries = @()
ForEach($key in $profileKeys) {
    $profile = $key.Name
    $profileDisplayName = $infoCache."$profile".name
    $newEntry = @{
         Profile = $profile;
         Name = $profileDisplayName;
    };
    $allEntries += $newEntry
}
$allEntries
And get the following result
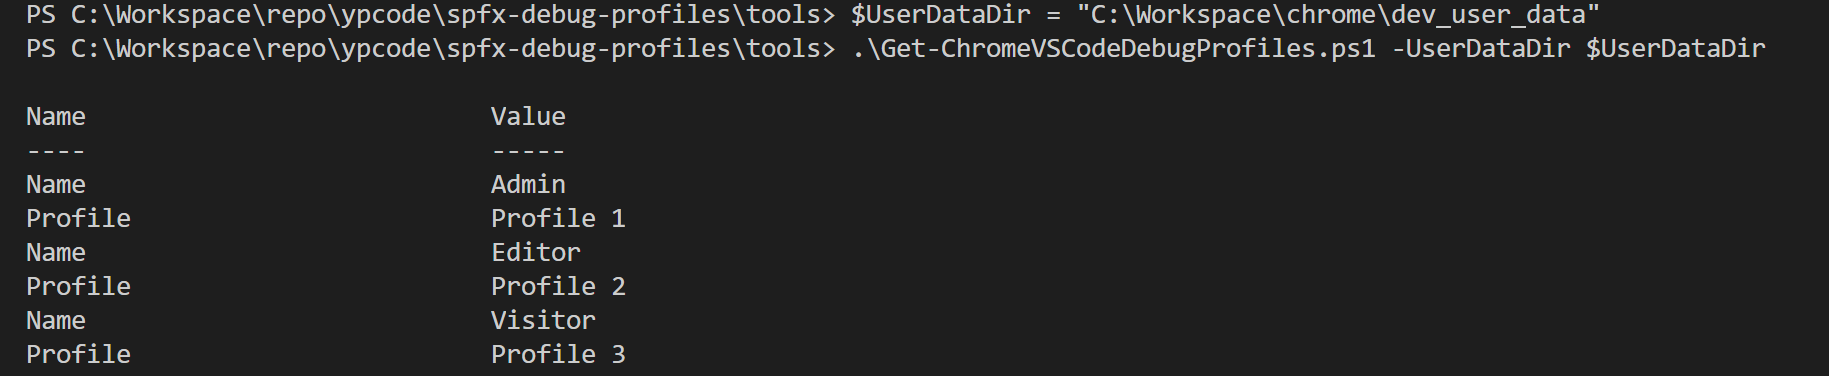
See how I can extract values from a complex JSON file ? Oh God, I LOVE PowerShell, let's do some more ! Put the following script in the same folder as the previous one
param(
    [string]$ConfigBaseName = "Workbench Profile ",
    [string]$Url = "https://your.sharepoint.com/sites/test/_layouts/workbench.aspx",
    [string]$UserDataDir = "C:\Workspace\chrome\dev_user_data"
)

# Get the profiles
$profiles = .\Get-ChromeVSCodeDebugProfiles.ps1 -UserDataDir $UserDataDir

$allConfigs = @()
ForEach ($profile in $profiles) {
    $profileName = $profile.Name
    $profileKey = $profile.Profile
    $newLaunchConfig = New-Object -TypeName psobject
    $newLaunchConfig |Add-Member -MemberType NoteProperty -Name "name" -Value $configBaseName$profileName
    $newLaunchConfig |Add-Member -MemberType NoteProperty -Name "type" -Value "chrome"
    $newLaunchConfig |Add-Member -MemberType NoteProperty -Name "request" -Value "launch"
    $newLaunchConfig |Add-Member -MemberType NoteProperty -Name "url" -Value $url
    $newLaunchConfig |Add-Member -MemberType NoteProperty -Name "webRoot" -Value "`${workspaceRoot}"
    $newLaunchConfig |Add-Member -MemberType NoteProperty -Name "sourceMaps" -Value $True
    $newLaunchConfig |Add-Member -MemberType NoteProperty -Name "userDataDir" -Value $userDataDir
    $newLaunchConfig |Add-Member -MemberType NoteProperty -Name "sourceMapPathOverrides" -Value @{
    "webpack:///../../../src/*"= "`${webRoot}/src/*";
    "webpack:///../../../../src/*"= "`${webRoot}/src/*";
    "webpack:///../../../../../src/*"= "`${webRoot}/src/*";
    }
    $newLaunchConfig |Add-Member -MemberType NoteProperty -Name "runtimeArgs" -Value @( "--remote-debugging-port=9222", "--profile-directory=$profileKey")

    $allConfigs += $newLaunchConfig
}

$allConfigs | ConvertTo-Json
And call it with these arguments:
_.\\GenerateDebugProfileLaunchConfig.ps1 -Url https://yourtenant.sharepoint.com/sites/yoursite/_layouts/workbench.aspx -UserDataDir $UserDataDir -ConfigBaseName "Hosted Workbench Profile "
And get the content to put in your launch.json file and save it
{
    "name": "Hosted Workbench Profile Admin",
    "type": "chrome",
    "request": "launch",
    "url": "https://yourtenant.sharepoint.com/sites/yoursite/_layouts/workbench.aspx",
    "webRoot": "${workspaceRoot}",
    "sourceMaps": true,
    "userDataDir": "C:\\Workspace\\chrome\\dev_user_data",
    "sourceMapPathOverrides": {
        "webpack:///../../../src/*": "${webRoot}/src/*",
        "webpack:///../../../../src/*": "${webRoot}/src/*",
        "webpack:///../../../../../src/*": "${webRoot}/src/*"
    },
    "runtimeArgs": [
        "--remote-debugging-port=9222",
        "--profile-directory=Profile 1"
    ]
},
{
    "name": "Hosted Workbench Profile Editor",
    "type": "chrome",
    "request": "launch",
    "url": "https://yourtenant.sharepoint.com/sites/yoursite/_layouts/workbench.aspx",
    "webRoot": "${workspaceRoot}",
    "sourceMaps": true,
    "userDataDir": "C:\\Workspace\\chrome\\dev_user_data",
    "sourceMapPathOverrides": {
        "webpack:///../../../src/*": "${webRoot}/src/*",
        "webpack:///../../../../src/*": "${webRoot}/src/*",
        "webpack:///../../../../../src/*": "${webRoot}/src/*"
    },
    "runtimeArgs": [
        "--remote-debugging-port=9222",
        "--profile-directory=Profile 2"
    ]
},
{
    "name": "Hosted Workbench Profile Visitor",
    "type": "chrome",
    "request": "launch",
    "url": "https://yourtenant.sharepoint.com/sites/yoursite/_layouts/workbench.aspx",
    "webRoot": "${workspaceRoot}",
    "sourceMaps": true,
    "userDataDir": "C:\\Workspace\\chrome\\dev_user_data",
    "sourceMapPathOverrides": {
        "webpack:///../../../src/*": "${webRoot}/src/*",
        "webpack:///../../../../src/*": "${webRoot}/src/*",
        "webpack:///../../../../../src/*": "${webRoot}/src/*"
    },
    "runtimeArgs": [
        "--remote-debugging-port=9222",
        "--profile-directory=Profile 3"
    ]
}
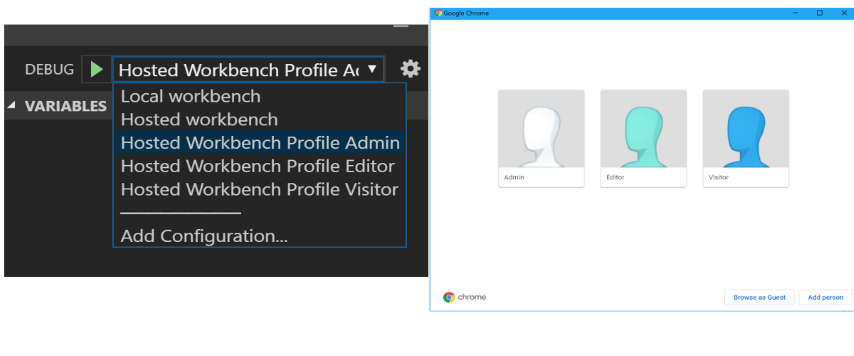
Go to the debug pane and see the new debug configurations
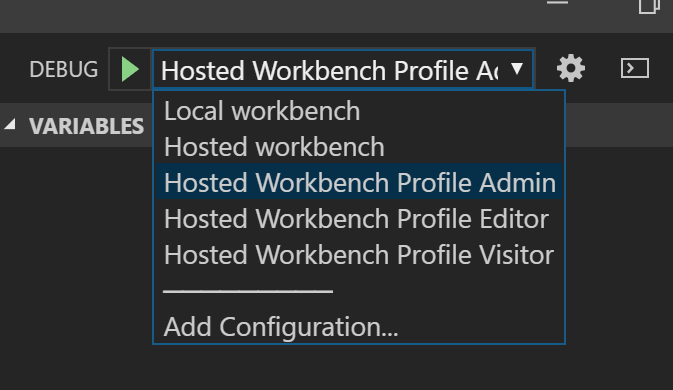
Select a config and start debugging, you already logged in with you pre-configured session and it will keep whatever you save in these profiles !
That's it
I am convinced it will ease testing and switching user context on dev time for me, happy to share the technique, If you have ideas to improve it and concerns that I missed, please, let me know !
Cheers !
Yannick